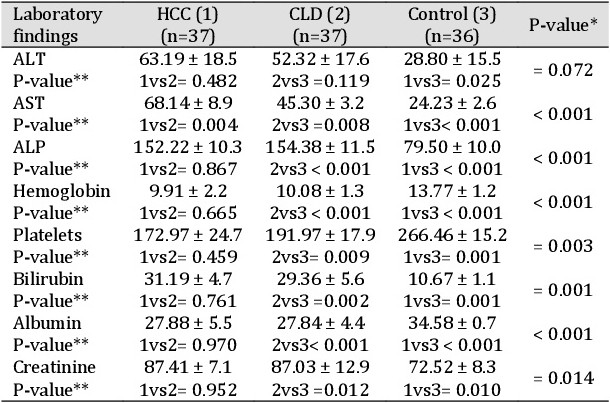
Table 2. Laboratory findings in the study groups. *Chi-square test was used to compare the percentages between groups. **Z-test was used to compare the improvement percentages. ***ANOVA test was used to compare the mean difference between groups. $Student's t-test was used to compare the mean difference between the two groups